logo Data Analytics and Collaborative Computing Group
– Soft Computing, Data Mining, Information Visualisation –

Applications

Here is a sampling of some of the applications developed by our group.
Stream 1: Soft Computing
Evaluation of Workflow Escalation
Simulation-based Evaluation of Workflow Escalation Strategies (2009)
Workflows in the service industry sometimes need to deal with multi-fold increases in customer demand within a short period of time. Such spikes in service demand may be caused by a variety of events including promotional deals, launching of new products, major news or natural disasters. Escalation strategies can be incorporated into the design of a workflow so that it can cope with sudden spikes in the number of service requests while providing acceptable execution times. In this research, we develop a method for evaluating escalation strategies using simulation technology. The effectiveness of the proposed method is demonstrated on a workflow from an insurance company.
Temporal Exception Prediction
Temporal Exception Prediction for Loops in Resource Constrained Concurrent Workflows (2009)
Workflow management systems (WfMS) are widely used for improving business processes and providing better quality of services. However, rapid changes in business environment can cause exceptions in WfMS leading to deadline violation and other consequences. In these circumstances, one of the crucial tasks for a workflow administrator is to detect any potential exceptions as early as possible so that corrective measures can be taken. However such detections can be extremely complex since a workflow process may consist of various control flow pattern and each pattern has its own way of influencing temporal properties of a task. In this research, we describe a novel approach for predicting temporal exceptions for loops in concurrent workflows which are required to share limited identical resource pools. Our approach is divided into two phases; preparation phase and prediction phase. In the preparation phase, temporal and resource constraints are calculated for each task within the workflow schema. In the prediction phase, an algorithm is used to predict potential deadline violations by taking into account constraints calculated from the preparation phase.
Web Application Simulation
Modeling Support for Simulating Traffic Intensive Web Applications (2009)
Business Process Simulation (BPS) has been widely accepted as a modus operandi for evaluating business applications and for understanding the strength and weakness of the implemented system. However, less attention has been devoted to applying BPS for simulating traffic intensive applications hosted on the Internet. These systems are inherently different from typical enterprise-wide business applications since the number of hits received at the application' s Web site can fluctuate to a large degree depending on the external factors (e.g. political unrest causing overbooking in airlines). In addition, every hit does not necessarily lead to a successful completion of a transaction since users can navigate away to other Web sites during the browsing. The proposed system utilizes audit trail data and Web server logs which contain vital information about the interaction between clients and the Web application.
Contact Tracing
Contact Tracing for Infectious Disease Control and Quarantine Management (2009)
Highly infectious diseases such as SARS (Severe Acute Respiratory Syndrome), Avian Influenza (Bird Flu), Small Pox, and currently Swine Flu, to name but a few, pose a significant threat to the global population. Detection and prevention of infectious diseases is notoriously complex and problematic due to the ever increasing number of international travelers. In addition, the risk of being infected with an infectious disease in densely populated urban areas tends to be much higher compared to rural areas. When an outbreak occurs, the detection of source of infection (or index case), clusters of cases and transmission routes in a rapid manner is crucial in preventing the infectious disease from further spreading. Contact tracing has proven to be helpful for these detections. Traditionally, contact tracing is a field work of the medical personnel with little assistance of IT (Information Technology), if any. During the worldwide outbreak of SARS in 2003, HCIS (Health Care Information Systems) were built to facilitate contact tracing. However, contact tracing, and thus the detection process, is not a fully automatic process in these systems. In this research, with SARS as a case study, we realize detection as an automatic process by applying algorithms and data mining techniques in the patients' activities and social interaction together with characteristics of the infectious disease.
Fuzzy Adaptive Agent
Fuzzy Adaptive Agent for Supply Chain Management (2006)
Recent technological advancement in electronic commerce has fuelled the need for designing effective strategies for supply chain management. Two crucial tasks in supply chain management are the planning of raw material acquisition for inventory and competing for customer orders. Maintaining a flexible yet an adequate inventory level is a complex task due to the fluctuation in suppliers' production capacity and changing customers' demand. Designing an effective strategy for bidding customer orders is also a difficult problem due to the intense competition in fast changing market environment. In this research, we describe the strategies of a supply chain management agent which adaptively adjusts its target inventory level and customer order bidding price based on Fuzzy Logic reasoning. The agent has competed in the 2006 Trading Agent Competition for Supply Chain Management and has achieved good result.

Stream 2: Data Mining
Enhanced OLAP Architecture
Integrated Enhancement of OLAP and Data Mining (2009)
OLAP performance and its data visualization can be improved using different types of enhancement techniques. Previous research has taken two separate directions in OLAP performance improvement and visualization enhancement respectively. Some recent works have shown the benefits of combining OLAP with Data Mining. Our previous work presents architecture for the enhancement of OLAP functionality by integrating OLAP and Data Mining. In this project, we proposed a novel architecture that not only overcomes the existing limitations, but also provides a way for an integrated enhancement of performance and visualization. We have developed a prototype and validated the proposed architecture using real-life data sets. Experimental results show that cube construction time and its interactive data visualization capability can be improved remarkably. By integrating enhanced OLAP with data mining system a higher degree of enhancement is achieved which makes significant advancement in the modern OLAP systems. Finally, we emphasize the coupling of OLAP and Data mining in a framework that supports both integrated OLAP performance improvement and visualization enhancement.
Performance Evaluation of e-Government Portal
Mining for Performance Evaluation of e-Government Portal (2009)
An e-Government portal represents not only a reputable public image of the sovereignty of a region, it is responsible for serving many users from local citizens and beyond, in a reliable way. The requirement for robustness of e-Government portal becomes relatively stringent. In view of this, it would be very useful to have an independent server that serves as a 24/7 watch-guard to monitor the performance of the service portal. In this project, we designed a Web-based performance monitoring system (WMS) for checking the health status and some extras, of the service portal in real-time. Some basic server statuses are usually provided by the web hosting company at which the service portal is hosted. Usually they are simple statistics such as the number of hits and server loads over a selected period of time. Further details regarding the performance of the portal however may not be available or they come in expensive prices. This chargeable service is either by some third-party proprietary commercial software tools on the market or by provision of external analytic jobs of consultancy. In contrast, the advantages of WMS are additional performance checks and open source in Java for easy future development. It features web usage mining from web log files in addition to the computation of statistics offered by the hosting company. A higher level of analytic insights can be obtained too when the two combined. The functions of WMS include (1) Web Log Analysis, (2) Web Usability Analysis, (3) Website Performance Benchmarking, (4) Web Link Validation, and (5) Performance Reporting. WMS can be used as a generic monitoring tool for virtually all kinds of e-business models.
Stock Market Trend Analysis
Time Series Trend Analysis in Stock Market (2008)
Trend-following (TF) strategies use fixed trading mechanism in order to take advantages from the long-term market moves without regards to the past price performance. In contrast with most prediction tools that stemmed from soft-computing such as neural networks to predict a future trend, TF just rides on the current trend pattern to decide on buying or selling. While TF is widely applied in currency markets with a good track record for major currency pairs, the strategies are doubted if they do apply universally. In this project a new TF model that features both strategies of evaluating the trend by static and adaptive rules, is created from simulations and later verified on Hong Kong Hang Seng future indices. The model assesses trend profitability from the statistical features of the return distribution of the asset under consideration. The results and examples facilitate some insights on the merits of using the trend following model.
Dynamic Supply Chains
Decision-support for Optimizing Supply Chain Formation (2008)
Supply chain formation problem is one of the important research topics in e-Commence. In an e-Marketplace where buyers and sellers meet and trade online, dynamic supply chains can be formed among them by mediating agents. SET and CSET are two typical make-to-order supply chain models. CSET represents a scenario that has a central authority in charge of the formation, management and dissolution of a supply chain. The principal authority selects the partners under certain principles which may either aim for maximizing profits of the whole supply chain or for ensuring every partner to receive a job for communal prosperity. In SET, every supply chain partner uses local knowledge to compete for jobs at each supply chain level. We have implemented a Java-based simulator for simulating the process of dynamic supply chain formation. The simulator can operate in both modes whose results are useful in decision-support in supply chain planning.
Suspicious Pattern Detection
Detecting Suspicious Patterns in Secure Physical Environment (2007)
Security in physical environments has become increasingly important in the wake of terror and criminal activity, particularly over the past decade. One of the challenges is to identify activities that may not be outright illegal or breaches of security, but that are suspicious, i.e. where there is a possibility that these activities may lead to breaches of security. Technology such as RFID is used to track the access and movement of people in highly security physical environments. This project searches for methods of detecting patterns of suspicious activity in logs collected by such physical access control systems. It also outlines methods of predicting future suspicious activities based on such logs. Based on this concept, a real-time suspicious access patterns detection system is to be developed, which can provide a powerful security measure to RFID systems, in a closely monitored physical environment. The proposed system may monitor the physical object movements and hunt for potential security threats out of a large number of normal object movements.
University Admission Recommender System
An Automated University Admission Recommender System for Secondary School Students (2007)
University or college admission is a complex decision process that goes beyond simply matching test scores and admission requirements. Past research has suggested that students' backgrounds and other factors correlate to the performance of their tertiary education. However, almost all admission and enrollment studies are based on the perspective of universities or colleges, and only few studies are based on the perspective of secondary schools. This project presents a hybrid model of neural network and decision tree classifier that serves as the core design for a university admission recommender system. The system was tested with live data from sources of Macau secondary school students. In addition to the high prediction accuracy rate, flexibility is an advantage such that the system can predict suitable universities that match the students' profiles and the suitable approaches through which the students should enter. The recommender can be generalized into making different kinds of predictions based on the students' histories.
GA-based E-Commerce Recommender
GA-Based Collaborative Filtering For E-Commerce Recommenders (2007)

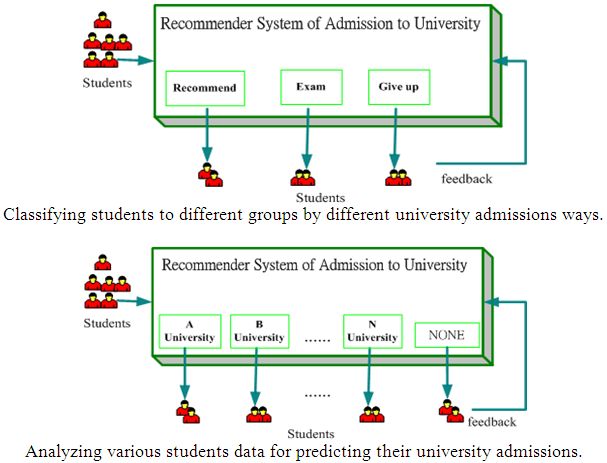
Many e-Commerce websites have widely adopted recommenders systems to automatically suggest products or services to customers for enhancing their online experiences. Amazon.com is a classical example. Recommenders assist users to narrow down their choices for making a purchase decision from a large pool of items. A simple recommendation can be generated based on the top selling products. This however assumes every customer has a common taste by a 'one-size-fits-all' approach. A more advanced approach is known as one-to-one marketing, which considers the profile of a particular user and searches for a personal match of product that is predicted to be most likely he will favour best. The technical core mechanism in e-Commerce recommenders is usually implemented in software programs by three types of filtering techniques, namely: Content-based filtering, Collaborative Filtering (CF) and Hybrid Models.

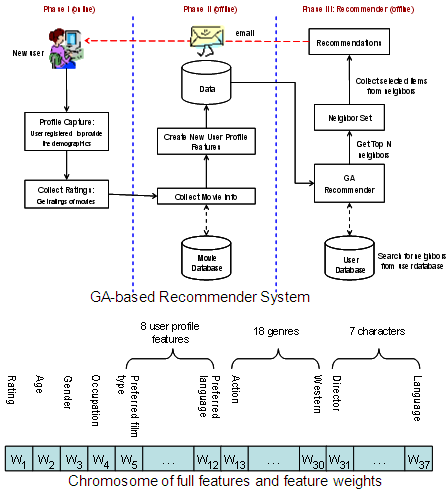
Since different types of filtering techniques have their shortcomings but advantages in certain aspects, combining them may be a promising solution provided there is a novel way of overcoming a large amount of input variables. When the filtering techniques are fused to work together, almost all the information and the relative weights about the products, users, and users' activities would be required. Genetic algorithm (GA) is an ideal optimization search function, for finding a best recommendation out of a large population of variables. Here, we present a GA-based approach for supporting hybrid modes of CF. We show how the input variables can be coded into GA chromosomes in various modes. Insights of how GA can be used in e-commerce recommenders are derived through our experiments.

GSM Mining
Data Mining GSM Network Resources for Supporting QOS of Mobile Payment (2006)
In mobile commerce, short-message-service (SMS) is an important technique for delivering payment instruction. A payment model "SMS Credit" was proposed earlier by us. Such payment service or similar relies on the transmission of SMS; it is needed to reduce the occurrence of packet losses, delay and to improve the quality of packet transmission services (QOS) in the network. This project investigates on how the payment service operates in a configurable radio resource environment via data mining. A Radio Resource Management and Prediction Server equipped with data mining algorithms will optimize the radio resources for both voice and data services in order to provide an optimized QOS. Specifically, data mining techniques are applied to define traffic policy and to calculate optimization result through traffic profile analysis.
Web Watcher Agent
Web Watcher Agent for Marketing Information Monitoring (2004)
World-Wide-Web is a huge pool of valuable information for companies to know what their competitors are doing and what products and services they offer up-to-date. Companies can gather business intelligence from the Web for planning countermeasures strategies. Hence it is crucial to have the right tool to effectively gather such information from the Web. Many information retrieval and monitoring technologies have been developed. But they are more for generally tracking changes and downloading the whole websites for offline browsing. This project is to study on specifically the design of a Web monitoring system for gathering business information relevant to a company. The Watcher Agent is a server-based system that is built with two main parts, namely Price Watcher and Market Watcher. The system will assist company users in price information collection, news information filtering, and product ranking estimation, thus saving time and effort for them.

Stream 3: Information Visualisation
Wiki Recent Changes Visualization
Wiki Recent Changes Visualization (2011)
This work has developed a visualization that allows the display of current and recent editing activity in Wikipedia, enabling an administrator to quickly obtain an overview of some noteworthy editing patterns occurring in the Wikipedia at the present moment.
Wiki Category Radial Visualization
Wiki Category Radial Visualization (2011)
This project has developed a visualization of the Wikipedia content (i.e. all Wikipedia articles) in a radial representation which highlights latent connections between co-assigned categories of these articles.
Map-like Wiki Category Visualization
Map-like Wiki Category Visualization (2011)
This work has developed a visualization of the Wikipedia category hierarchy in the form resembling a geographic map.
Wiki Category Matrix Visualization
Wiki Category Matrix (2010)
This work was our first effort to create an overview visualization of category assignments in Wikipedia. In Wikipedia authors are free to classify articles into categories, making as many such category assignments as they wish. Categories themselves are hierarchically organized, with sub-categories down any number of levels. We were interested to know the distribution of content over categories, expecting to find gaps or relatively sparse areas, and other areas with a large concentration of content. In order to test this hypothesis we decided to create a graphical representation of category assignment that would allow us to visually identify such patterns. To do so the first step was to simplify the category hierarchy, which contained both loops and multiple parents, into a tree structure. We then calculated similarity between categories based on a cosine similarity function. Having similarity values, we arranged categories in a row, with the most similar categories next to each other. This resulted in a one-dimensional spectrum of categories which we mapped onto both the x and y axes of a matrix. Thereafter we traced the top-level and second-level categories that each article belonged to by traversing the tree from the article's assigned category up to the root. Taking each article's first two assigned categories (which we assumed to be most representative of its content), we represented the number of articles assigned to a given pair of categories as a proportionally sized dot aggregating all articles assigned to these two categories on the corresponding x,y coordinate in our matrix. Moreover, second-level category assignments ("small dots") belonging to the same top-level category are aggregated to a single top-level category dot ("big dots"). The result is shown in a matrix like in the above figure (as the matrix is symmetric mirrored along its diagonal we only draw half the matrix). Our hypothesis is indeed confirmed. There are some categories that consistenly have many articles with every other category (taken articles' first/second category assignment), whereas other categories have a much less even distribution of articles over second categories. The figure shown here is from the Swedish Wikipedia and shows some highlights of top-level categories with sub-categories (a); and numbers of articles by first/second category visualized as dots (b).
BambooGarden
BambooGarden (2009)
This work developed an information visualization application for visualizing a user's instant messaging history. Users may want to reflect on their communication patterns with their chat partners: obtaining a quick overview of their message history, who the main chat partners are in terms of bulk of chat conversations, whether chat messages are happy or sad in content, whether conversations tend to be short or drawn out, whether they are sporadic or regular daily exchanges, and many other social aspects connected with their person-to-person instant messaging communication. In order to reveal these aspects of the communication we have employed the bamboo as a visualization metaphor: each chat partner (i.e. IM buddy) is shown as a bamboo plant, and the group of all chat partners is shown as a bamboo garden. Each chat conversation is shown as a branch on the bamboo trunk. As the vertical dimension corresponds to time (growing from bottom up, like the bamboo itself), the position on the trunk indicates the conversation's position in time. The length of the branch correponds to the length of the conversation, with each chat message represented as a leaf on the branch, its position corresponding to the time of the message during the conversation. Leaf size corresponds to message size. This part of the visualization is somewhat similar to PeopleGarden, developed by Xiong and Donath at MIT in 1999 and which gave an inspiration to our work. However, BambooGarden goes beyond PeopleGarden in analyzing and visualizing the emotional state of the chat messages. We look for emoticons (smiley faces) and certain keywords in the chat text to infer one of four different emotional states: happiness, sadness, anger and a neutral state. These emotional states are mapped to four different colours.
Wiki Analysis for MediaWiki
Wiki Analysis (2009)
This project developed an extension to MediaWiki, the wiki engine used to run the popular Wikipedia site and other wiki sites. This extension provides analytical abilities, tightly integrated in the MediaWiki software and user interface. For any page, the user of the Wiki Analysis extension can do three kinds of analysis: (1) text comparison, to compare differences between versions, which includes not only insertion and deletion of text which are standard in MediaWiki but also a GA-driven matching function for finding similar text; the ability to detect old text that has been replaced with new text; detecting text that has been moved up or down relative to other text; and a highlighted text display showing which word was contributed by (or "belongs" to) which author. (2) page evolution, which shows the evolution of both the article page and its attached discussion page over time, in absolute size; and allows the display of an individual author's contribution and their evolution over time, both as all cumulative contributions as well as all surviving contributions after being edited. (3) contribution summary which displays the amount of contributions by different authors to different parts of the wiki (article and discussion, volume and number of times of contribution). (4) user-to-page contribution which visualizes the temporal patterns of one or more users contributing to different wiki pages over a given period of time.
MediaWiki Co-Authors Extension
MediaWiki Co-Authors and Expert Finder (2008)
In this work targeted at MediaWiki, the system underlying the Wikipedia collaborative user-contributed encylopedia, we developed a method and algorithm for determining the degree of co-authorship among the users who contribute to wiki articles. Unlike in conventional authoring where co-authoring is explicit and usually spans the entire writing process, in wikis co-authoring is implicit and can be temporally disjoint, thus the co-authoring relationship can be of different strength. Our algorithm measures the degree of co-authorship among a pair of authors. We have implemented this as a MediaWiki extension that can find the co-authors of a given user. A further MediaWiki extension builds on this to uncover expertise groups on a given topic in the wiki system, given the extent of involvement of individual authors as well as their significant co-authors.
Wiki Text Analyzer
Wiki Text Analyzer (2007)
In wiki systems users collaborate with each other in the production of content. To uncover detailed aspects of these processes we have developed a visualization system that allows us to perceive user involvement, contribution, process evolution, and patterns of engagement with the text and each other's contributions.
Desktop
		Search Visualization
Visualization for Google Desktop Search Engine (2006)
Modern desktop computers contain thousands, possibly tens of thousands of files. Desktop search engines help in locating files that the user knows are "somewhere there". However, search results themselves can be overwhelmingly large. Therefore this system interfaces with the Google desktop search engine to present search results in graphical form as a visualization of pertinent information. A 2-dimensional display of the directory hierarchy of the user's desktop computer is generated, and search results are highlighted in the display. The development of this system gave us the opportunity to explore layout problems of large tree-structured hierarchies.
WikiVis
WikiVis - Wikipedia Visualization (2005)
Wikipedia is a popular online user-contributed encyclopedia with numerous different language editions. This project has developed a visualization of the Wikipedia information space, primarily as a means of navigating the category hierarchy as well as the article network. The project is implemented in Java, utilizing the Java 3D package.

© Data Analytics and Collaborative Computing GroupDepartment of Computer and Information ScienceFaculty of Science and TechnologyUniversity of Macau
Last modified: Wed 3 Feb 2016 09:10:01 UTC by robertb
HTML5 CSS level 3